CROSS-CUTTING

Methods & Tools

Which method is fit for this decision—and what can it not tell us?

A cross-cutting teaching area for GIS, process simulation, machine learning, LCA, TEA, optimization, scenarios and uncertainty. It is not a fifth Wang Group research module.

Open lesson
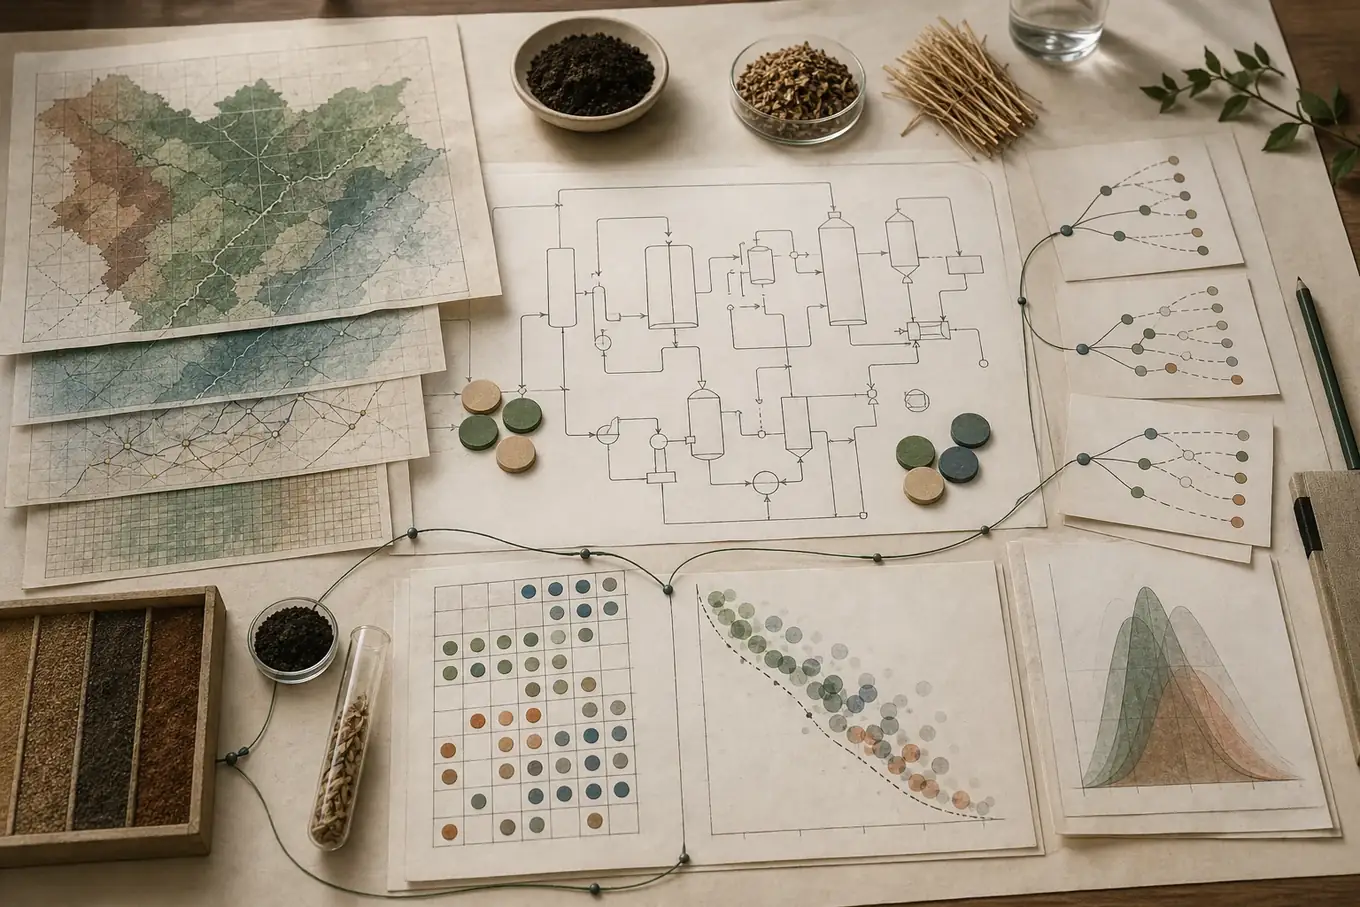
Research desk combining map layers, flowsheet, material-balance tokens, matrix, scenario branches and Pareto alternatives as cross-cutting methods.METHODS
01

When to use what

  • GIS and spatial analysis
  • Process simulation
  • ML and data-driven models
02

Decision analysis

  • LCA and TEA
  • Optimization and scenarios
  • Uncertainty and decision support

CURRICULUM

6 lessons

176 min

CONNECTED ROUTES

Learning paths

Carbon Removal from Biomass

Evaluate biomass-based carbon removal from resource constraints and conversion yields to durability, additionality and system outcomes.

Sustainable Fuels & SAF

Compare sustainable aviation fuel pathways across feedstocks, process trains, logistics, carbon intensity, cost and scale-up.

EVIDENCE LIBRARY

Research, models & tools

A curated starting shelf for this teaching area.

TOOLS

Related tools

QGIS / OSGeo

QGIS

An open-source geographic information system for viewing, managing and analysing spatial data.

Use it when
Where are resources, constraints, infrastructure and people located?
Limits
Spatial precision does not guarantee data accuracy, causality or social acceptance.
Inputs, outputs & scope
Inputs
Vector and raster layers, coordinate systems, attributes and analysis rules.
Outputs
Maps, spatial metrics, buffers, overlays and exportable datasets.
Typical applications
Resource mapping, logistics, site screening, exposure and territorial analysis.
LBNL / JBEI

BioSiting

A geospatial platform for exploring U.S. bioeconomy resources, infrastructure and candidate sites.

Use it when
What resources and infrastructure surround a candidate facility location?
Limits
A screening map is not a permit, supply contract or deployability decision.
Inputs, outputs & scope
Inputs
Location, buffer radius, resource layers, infrastructure and pathway choices.
Outputs
Mapped inventories, buffer summaries and downloadable spatial data.
Typical applications
Facility screening, resource context and early TEA/LCA framing.
BioSTEAM project

BioSTEAM

An open-source process simulation framework with integrated TEA, LCA and uncertainty workflows.

Use it when
How do unit operations combine into material, energy, cost and impact results?
Limits
Outputs are only as credible as property methods, scale-up rules and input evidence.
Inputs, outputs & scope
Inputs
Thermodynamics, streams, reactions, unit operations, design and economic assumptions.
Outputs
Flowsheets, mass and energy balances, equipment sizes, costs and life-cycle indicators.
Typical applications
Biorefineries, separation trains, plastic upcycling and early-stage process comparison.
SALib project

SALib

An open-source Python library for global sensitivity analysis, including Sobol, Morris and FAST methods.

Use it when
Which uncertain inputs drive model-output variation, interactions or screening priorities?
Limits
Method choice, sampling design, model cost and correlated inputs require deliberate treatment; rankings are conditional on specified ranges.
Inputs, outputs & scope
Inputs
A defined parameter problem, sampled input sets and corresponding model outputs.
Outputs
Method-specific sensitivity indices, confidence intervals and screening rankings.
Typical applications
Global sensitivity analysis for process, TEA, LCA and system models.
pymoo project

pymoo

An open-source Python framework for single-, multi- and many-objective optimization, visualization and decision support.

Use it when
How can a set of non-dominated alternatives be generated and diagnosed under conflicting objectives?
Limits
Algorithm output depends on formulation, scaling and convergence checks; the software does not choose social preferences.
Inputs, outputs & scope
Inputs
Decision variables, objective functions, constraints, algorithms and termination criteria.
Outputs
Candidate Pareto sets, convergence diagnostics and visualizations for comparison.
Typical applications
Technology portfolios, supply networks, process design and other multi-objective system choices.
CASE STUDIES

Examples from Wang Group

2022Outcomes

Novel carbon-negative methane production via integrating anaerobic digestion and pyrolysis of organic fraction of municipal solid waste

Illustrates an integrated organic-waste pathway where process coupling and the counterfactual waste fate determine the carbon claim.

2023Resources

Van Krevelen diagrams based on machine learning visualize feedstock-product relationships in thermal conversion processes

Shows how machine learning and Van Krevelen space can make feedstock–product relationships legible without turning the model into the research question itself.

REFERENCES

References & further reading

  1. U.S. Department of Energy (2024). Feedstock-Conversion Interface Consortium: Crosscutting Analysis Research.Open source
  2. International Organization for Standardization (2006). ISO 14040:2006 Environmental management — Life cycle assessment — Principles and framework.Open source
  3. Hart, Watson and Woodruff (2011). Pyomo: modeling and solving mathematical programs in Python.https://doi.org/10.1007/s12532-011-0026-8
  4. Cortes-Peña et al. (2020). BioSTEAM: A Fast and Flexible Platform for the Design, Simulation, and Techno-Economic Analysis of Biorefineries under Uncertainty.https://doi.org/10.1021/acssuschemeng.9b07040
  5. Noon and Daly (1996). GIS-based biomass resource assessment with BRAVO.https://doi.org/10.1016/0961-9534(95)00065-8
  6. U.S. Department of Energy (2024). 2023 Billion-Ton Report: An Assessment of U.S. Renewable Carbon Resources.https://doi.org/10.23720/BT2023/2316165
  7. QGIS / OSGeo (2026). QGIS Documentation.Open source
  8. Lawrence Berkeley National Laboratory / Joint BioEnergy Institute (2024). BioSiting Tool v2.Open source
  9. Préat et al. (2020). Identification of microalgae biorefinery scenarios and development of mass and energy balance flowsheets.https://doi.org/10.1016/j.algal.2019.101737
  10. BioSTEAM project (2026). BioSTEAM process simulation, TEA and LCA documentation.Open source
  11. Zhu, Li and Wang (2019). Machine learning prediction of biochar yield and carbon contents in biochar based on biomass characteristics and pyrolysis conditions.https://doi.org/10.1016/j.biortech.2019.121527
  12. Gopirajan et al. (2021). Optimization of hydrothermal liquefaction process through machine learning approach: process conditions and oil yield.https://doi.org/10.1007/s13399-020-01233-8
  13. Shule Wang, Yiying Wang, Ziyi Shi, Kang Sun, Yuming Wen, Lukasz Niedzwiecki, Ruming Pan, Yongdong Xu, Ilman Nuran Zaini, Katarzyna Jagodzińska, Christian Aragon-Briceno, Chuchu Tang, Thossaporn Onsree, Nakorn Tippayawong, Halina Pawlak-Kruczek, Pär Göran Jönsson, Weihong Yang, Jianchun Jiang, Sibudjing Kawi, Chi-Hwa Wang (2023). Van Krevelen diagrams based on machine learning visualize feedstock-product relationships in thermal conversion processes.https://doi.org/10.1038/s42004-023-01077-z
  14. Subramanyan et al. (2007). New stochastic simulation capability applied to the GREET model.https://doi.org/10.1065/lca2007.07.354
  15. Shule Wang, Yuming Wen, Ziyi Shi, Ilman Nuran Zaini, Pär Göran Jönsson, Weihong Yang (2022). Novel carbon-negative methane production via integrating anaerobic digestion and pyrolysis of organic fraction of municipal solid waste.https://doi.org/10.1016/j.enconman.2021.115042