Before you begin
Feedstock characteristics and conversion fit →The question
Will a model generalize beyond the data that trained it?
Learning objectives
- 01Distinguish prediction, classification, clustering and surrogate modelling.
- 02Design validation that reflects deployment conditions.
- 03Recognize leakage, extrapolation and interpretability limits.
Core explanation
ML can relate feedstock properties to products, emulate expensive simulations, detect patterns in heterogeneous literature or support control. The task and target variable must be scientifically meaningful.
Random train-test splits can overstate performance when nearby experiments, authors, sites or time periods appear in both sets. Grouped, temporal or external validation better represents use.
Feature importance describes model behavior under its data distribution; it is not causal proof. Physical constraints, uncertainty and applicability domains remain necessary.
Key concepts
Data leakage
Information unavailable at prediction time enters training or validation.
Applicability domain
Region of input space where a model has supporting evidence.
Surrogate model
A fast approximation of a costly model or experiment.
External validation
Testing on data independent of model development.
Visual explanation
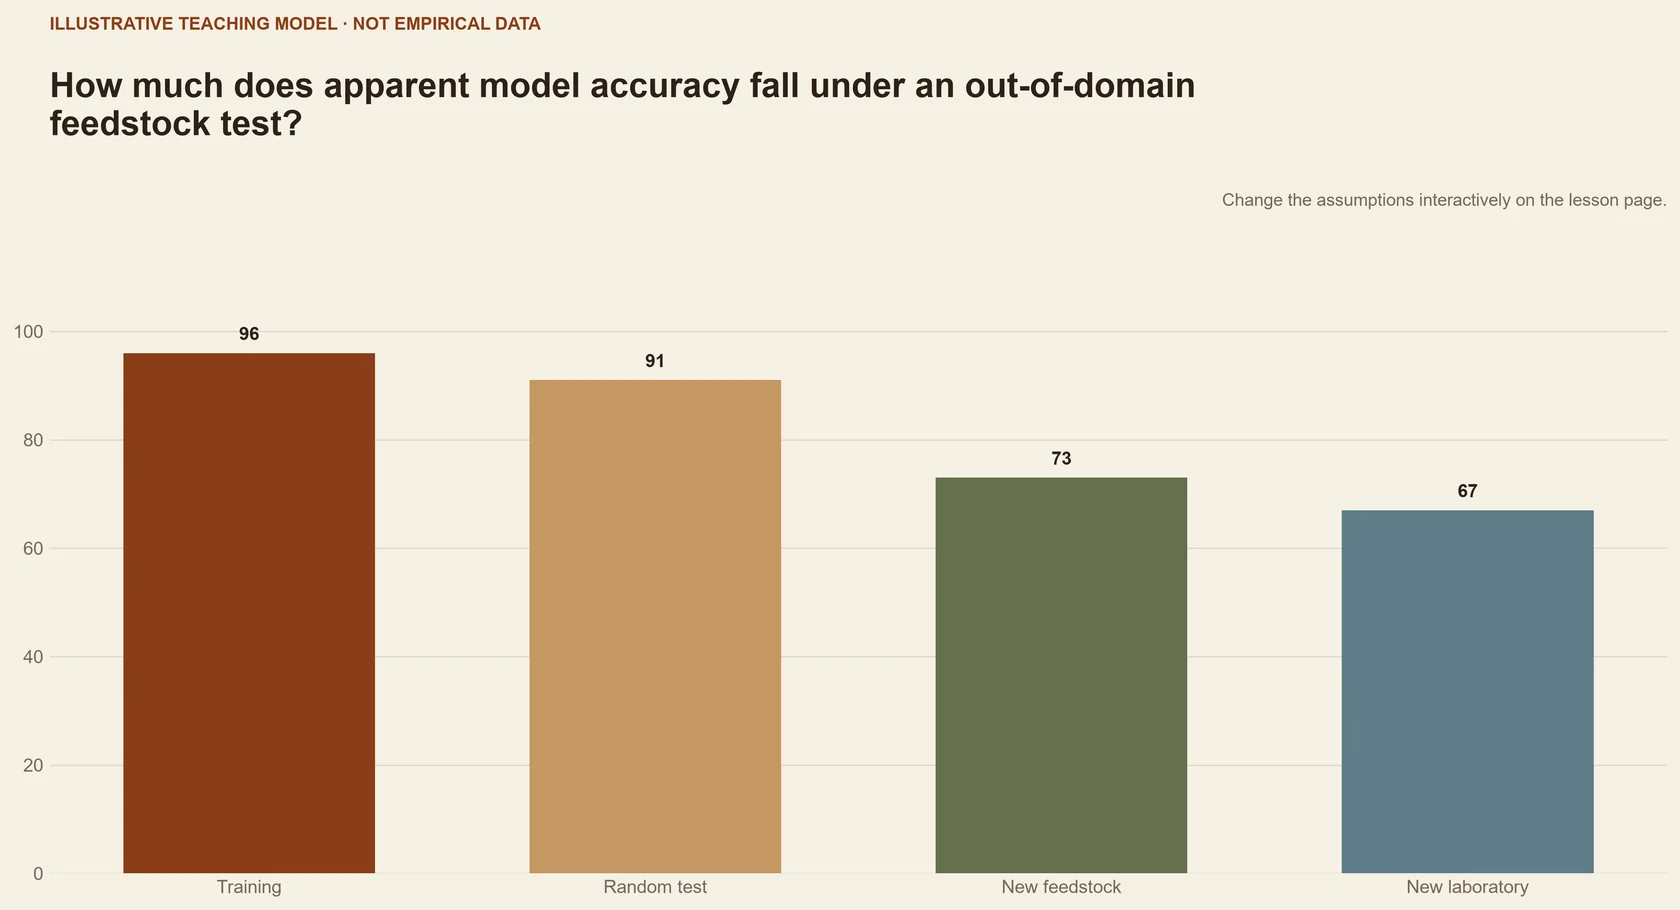
Explore · validation split lab
Compare random, grouped and external validation for heterogeneous bioeconomy data.
Switch validation strategies and inspect what leakage or domain shift each reveals.
iIllustrative learning model — values are not scientific results or forecasts.
Random split
Convenient, but near-duplicate feedstocks can leak across sets.
- Apparent score
- High
- Leakage risk
- High
Worked example
Predict a product class from feedstock properties
A literature dataset contains related experiments from the same publications.
- 01
Define the prediction target and remove post-outcome variables.
- 02
Split by publication or experimental group, not by row.
- 03
Report uncertainty and flag out-of-domain feedstocks.
Lower but honest validation performance is more useful than a leaked benchmark.
Case file
Van Krevelen diagrams based on machine learning visualize feedstock-product relationships in thermal conversion processes
- Why it is here
- This public data-driven study is well suited to examining chemical descriptors and validation scope.
- What to inspect
- Inspect dataset composition, descriptors, split strategy and interpretation.
- Limitation
- Predictive patterns remain conditional on the represented feedstocks and target measurements.
Core references
- Zhu, Li and Wang (2019). Machine learning prediction of biochar yield and carbon contents in biochar based on biomass characteristics and pyrolysis conditions.https://doi.org/10.1016/j.biortech.2019.121527 ↗
- Gopirajan et al. (2021). Optimization of hydrothermal liquefaction process through machine learning approach: process conditions and oil yield.https://doi.org/10.1007/s13399-020-01233-8 ↗
Further reading +1
- Shule Wang, Yiying Wang, Ziyi Shi, Kang Sun, Yuming Wen, Lukasz Niedzwiecki, Ruming Pan, Yongdong Xu, Ilman Nuran Zaini, Katarzyna Jagodzińska, Christian Aragon-Briceno, Chuchu Tang, Thossaporn Onsree, Nakorn Tippayawong, Halina Pawlak-Kruczek, Pär Göran Jönsson, Weihong Yang, Jianchun Jiang, Sibudjing Kawi, Chi-Hwa Wang (2023). Van Krevelen diagrams based on machine learning visualize feedstock-product relationships in thermal conversion processes.https://doi.org/10.1038/s42004-023-01077-z ↗
Knowledge check
Key takeaway
ML adds value when validation mirrors use and predictions stay inside an evidenced domain.
High cross-validation accuracy establishes causal understanding.
Data provenance, target definition, leakage controls, split logic, baselines, uncertainty, external validation and domain limits.