Before you begin
Spatial, seasonal and temporal supply →The question
Which spatial layers are necessary for the decision—and at what scale?
Learning objectives
- 01Distinguish raster, vector and network representations.
- 02Choose spatial resolution without creating false precision.
- 03Connect spatial evidence to siting and logistics decisions.
Core explanation
Bioeconomy systems are spatial: feedstocks are dispersed, transport networks are uneven, land and water constraints vary, and facilities serve territories rather than abstract averages.
Raster layers suit continuous surfaces; vector features suit parcels, boundaries and facilities; network models capture travel along roads or waterways. The representation must fit the process.
Aggregation changes results. County averages can hide local scarcity, while very fine grids can imply accuracy absent from source data. Report source resolution and test sensitivity to zoning.
Key concepts
Raster
A grid of cells storing spatial values.
Vector
Points, lines and polygons representing discrete features.
Network distance
Travel through a transport network rather than straight-line distance.
Modifiable areal unit problem
Results change when spatial units or boundaries change.
Visual explanation
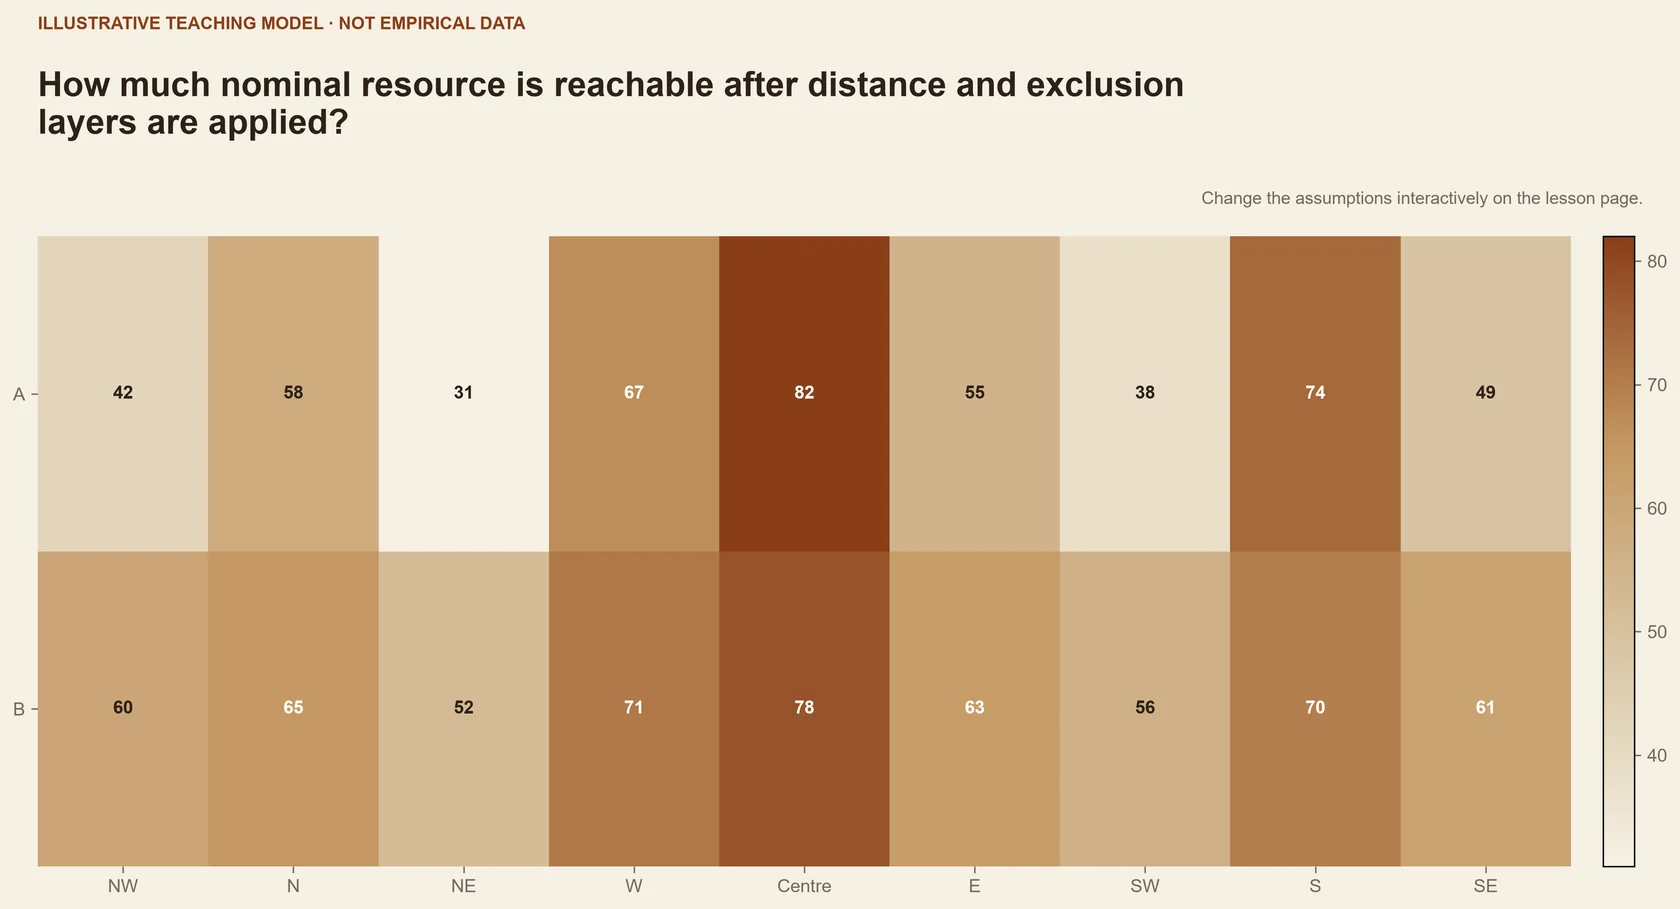
Explore · layer composer
Compose a GIS analysis while checking scale, provenance and spatial mismatch.
Turn layers on in decision order; the composer flags incompatible resolution or timing.
Worked example
From residue map to collection zones
A coarse supply layer is combined with roads, protected areas and facility candidates.
- 01
Exclude unavailable land and apply sustainable recovery fractions.
- 02
Route eligible supply through the transport network.
- 03
Aggregate by candidate catchment and retain resolution metadata.
The map supports screening; field validation and temporal data still determine feasibility.
Case file
GIS-based biomass resource assessment with BRAVO
- Why it is here
- BRAVO is a clear historical case of GIS-mediated resource decision support.
- What to inspect
- Inspect data layers, aggregation and decision outputs.
- Limitation
- Its historic data and methods should be learned from, not copied uncritically.
Tool in context
QGIS
- Use it for this task
- Compose, inspect and document spatial layers and transformations.
- Limitation
- Spatial precision does not guarantee data accuracy, causality or social acceptance.
Inputs, outputs & scope
- What it is
- An open-source geographic information system for viewing, managing and analysing spatial data.
- Problem it addresses
- Where are resources, constraints, infrastructure and people located?
- Inputs
- Vector and raster layers, coordinate systems, attributes and analysis rules.
- Outputs
- Maps, spatial metrics, buffers, overlays and exportable datasets.
- Typical applications
- Resource mapping, logistics, site screening, exposure and territorial analysis.
BioSiting
- Use it for this task
- Inspect a purpose-built national biomass siting workflow.
- Limitation
- A screening map is not a permit, supply contract or deployability decision.
Inputs, outputs & scope
- What it is
- A geospatial platform for exploring U.S. bioeconomy resources, infrastructure and candidate sites.
- Problem it addresses
- What resources and infrastructure surround a candidate facility location?
- Inputs
- Location, buffer radius, resource layers, infrastructure and pathway choices.
- Outputs
- Mapped inventories, buffer summaries and downloadable spatial data.
- Typical applications
- Facility screening, resource context and early TEA/LCA framing.
Core references
- Noon and Daly (1996). GIS-based biomass resource assessment with BRAVO.https://doi.org/10.1016/0961-9534(95)00065-8 ↗
- U.S. Department of Energy (2024). 2023 Billion-Ton Report: An Assessment of U.S. Renewable Carbon Resources.https://doi.org/10.23720/BT2023/2316165 ↗
Further reading +2
- QGIS / OSGeo (2026). QGIS Documentation.Open source ↗
- Lawrence Berkeley National Laboratory / Joint BioEnergy Institute (2024). BioSiting Tool v2.Open source ↗
Knowledge check
Key takeaway
Spatial analysis is about relationships and constraints, not simply making a map.
A high-resolution map guarantees high-resolution knowledge.
Source scale, coordinate system, exclusions, network data, temporal coverage, aggregation and ground truth.