Before you begin
Feedstock characteristics and conversion fit →The question
When and where can a facility actually receive feedstock?
Learning objectives
- 01Translate annual resource totals into spatial and monthly profiles.
- 02Explain how density and seasonality affect logistics and scale.
- 03Recognize resolution and year mismatch as data risks.
Core explanation
A regional total hides distance. The same mass can be concentrated near infrastructure or dispersed across many small sources. Spatial density shapes collection radius, transport mode, delivered cost, emissions and the scale a facility can support. Administrative averages can also conceal roads, terrain, protected areas and borders.
Seasonality creates an inventory problem. Harvest residues may arrive within weeks while a plant operates year-round. Storage loses dry matter, ties up capital, needs land and fire or moisture management, and can change quality. Organic wastes may be steadier but more perishable. A monthly balance can expose gaps that an annual balance hides.
Temporal supply also changes across years through yields, climate, management, policy, markets and technology. Document the observation year, scenario year and resolution of every layer before combining them. A visually precise map can still be temporally inconsistent.
Key concepts
Spatial density
Usable resource per unit area or network distance.
Seasonality
Predictable within-year variation in production, access or quality.
Storage loss
Quantity or quality lost between collection and use.
Resolution
The spatial or temporal detail at which data represent reality.
Visual explanation
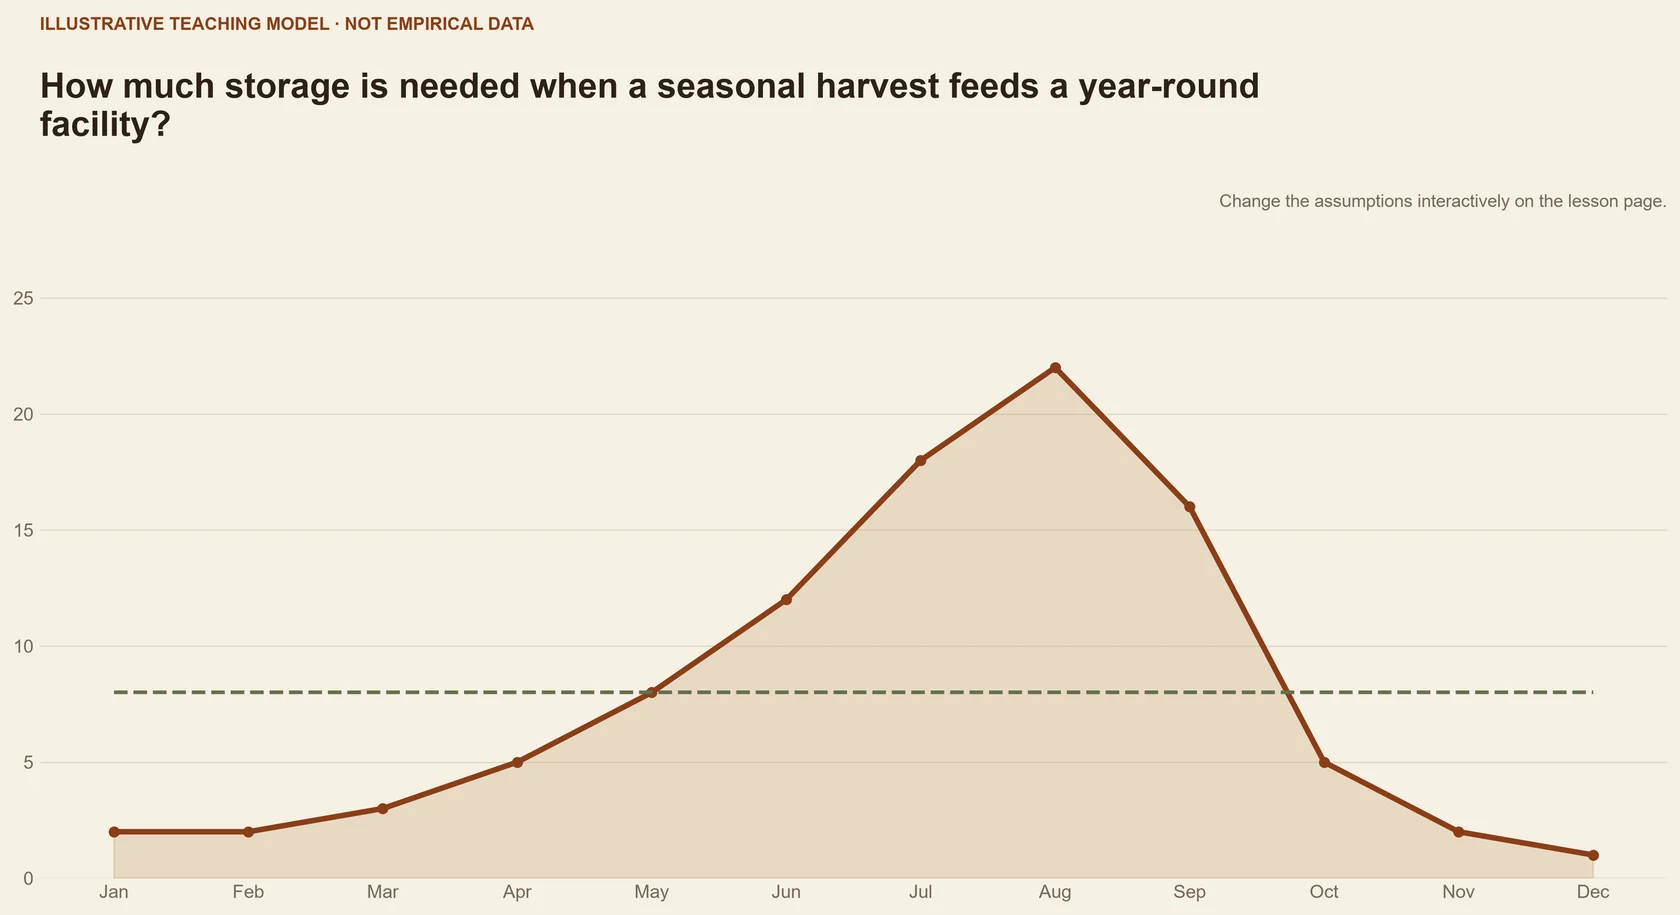
Explore · calendar map explorer
Combine spatial distribution, collection radius and seasonal availability.
Toggle map layers and months; then select a candidate hub to inspect its supply window.
iIllustrative learning model — values are not scientific results or forecasts.
October peak
High field supply; storage and truck queues become critical.
- Available nodes
- 8
- Storage pressure
- High
Worked example
Two territories with the same annual total
Territory A is concentrated and evenly supplied; Territory B is dispersed and harvest-peaked.
- 01
Draw network distances rather than straight-line distance alone.
- 02
Build twelve monthly supply-demand balances.
- 03
Add storage capacity, losses and a disruption month.
Equal annual mass does not imply equal plant scale, cost or resilience.
Case file
GIS-based biomass resource assessment with BRAVO
- Why it is here
- This early GIS study shows why biomass totals become spatial decisions.
- What to inspect
- Inspect the sequence from resource inventory to collection geography.
- Limitation
- Historic datasets and computing constraints differ from current practice.
Tool in context
BioenergyKDF
- Use it for this task
- Inspect public spatial resource layers and their metadata.
- Limitation
- Datasets differ in date, resolution and assumptions and must be reconciled before use.
Inputs, outputs & scope
- What it is
- A discovery portal for U.S. biomass resource data, analyses and bioenergy tools.
- Problem it addresses
- Where can analysts find documented resource and pathway data?
- Inputs
- Search terms, geography, resource classes and analysis needs.
- Outputs
- Datasets, metadata, reports and links to analysis tools.
- Typical applications
- Resource assessments, supply curves, scenario framing and provenance discovery.
Core references
- U.S. Department of Energy (2024). 2023 Billion-Ton Report: An Assessment of U.S. Renewable Carbon Resources.https://doi.org/10.23720/BT2023/2316165 ↗
- Noon and Daly (1996). GIS-based biomass resource assessment with BRAVO.https://doi.org/10.1016/0961-9534(95)00065-8 ↗
Further reading +2
- Welfle, Gilbert and Thornley (2014). Increasing biomass resource availability through supply chain analysis.https://doi.org/10.1016/j.biombioe.2014.08.001 ↗
- Oak Ridge National Laboratory / U.S. Department of Energy (2026). Bioenergy Knowledge Discovery Framework.Open source ↗
Knowledge check
Key takeaway
A resource becomes a supply only when it can arrive at the required place, quality and time.
Annual regional mass is sufficient to size a continuously operating facility.
Geocoded sources, network distances, monthly profiles, storage assumptions, observation years and uncertainty.