The question
Where does a biomass supply network lose reliability?
Learning objectives
- 01Map supply-chain stages from source to user and residual destinations.
- 02Connect density, moisture, seasonality and mode to delivered cost.
- 03Design for disruption and quality loss, not only average flow.
Core explanation
A biomass or waste supply chain can include field or source operations, aggregation, preprocessing, storage, loading, transport, reception, inventory and residual return. Ownership and measurement change at interfaces. Moisture, dry-matter loss, contamination and densification affect both useful mass and transport efficiency.
Transport burden depends on payload, distance, routing, backhaul, mode, fuel, road access and frequency—not distance alone. Preprocessing can reduce volume or moisture but adds capital, energy and potential loss. Centralized and distributed configurations should therefore be compared using the same final product and service boundary.
Reliability requires inventory rules, supplier diversity, alternative routes and quality acceptance. A chain optimized for an average harvest year can fail during weather disruption, road restrictions or competing demand. Test monthly and adverse scenarios and expose who carries inventory, price and performance risk.
Key concepts
Delivered cost
Total relevant cost of supplying usable material at the receiving gate.
Densification
Increasing bulk density to improve handling or transport, with added processing burdens.
Backhaul
Use of return capacity that can change transport economics and emissions.
Resilience
Ability to maintain acceptable service through disruption and recovery.
Visual explanation
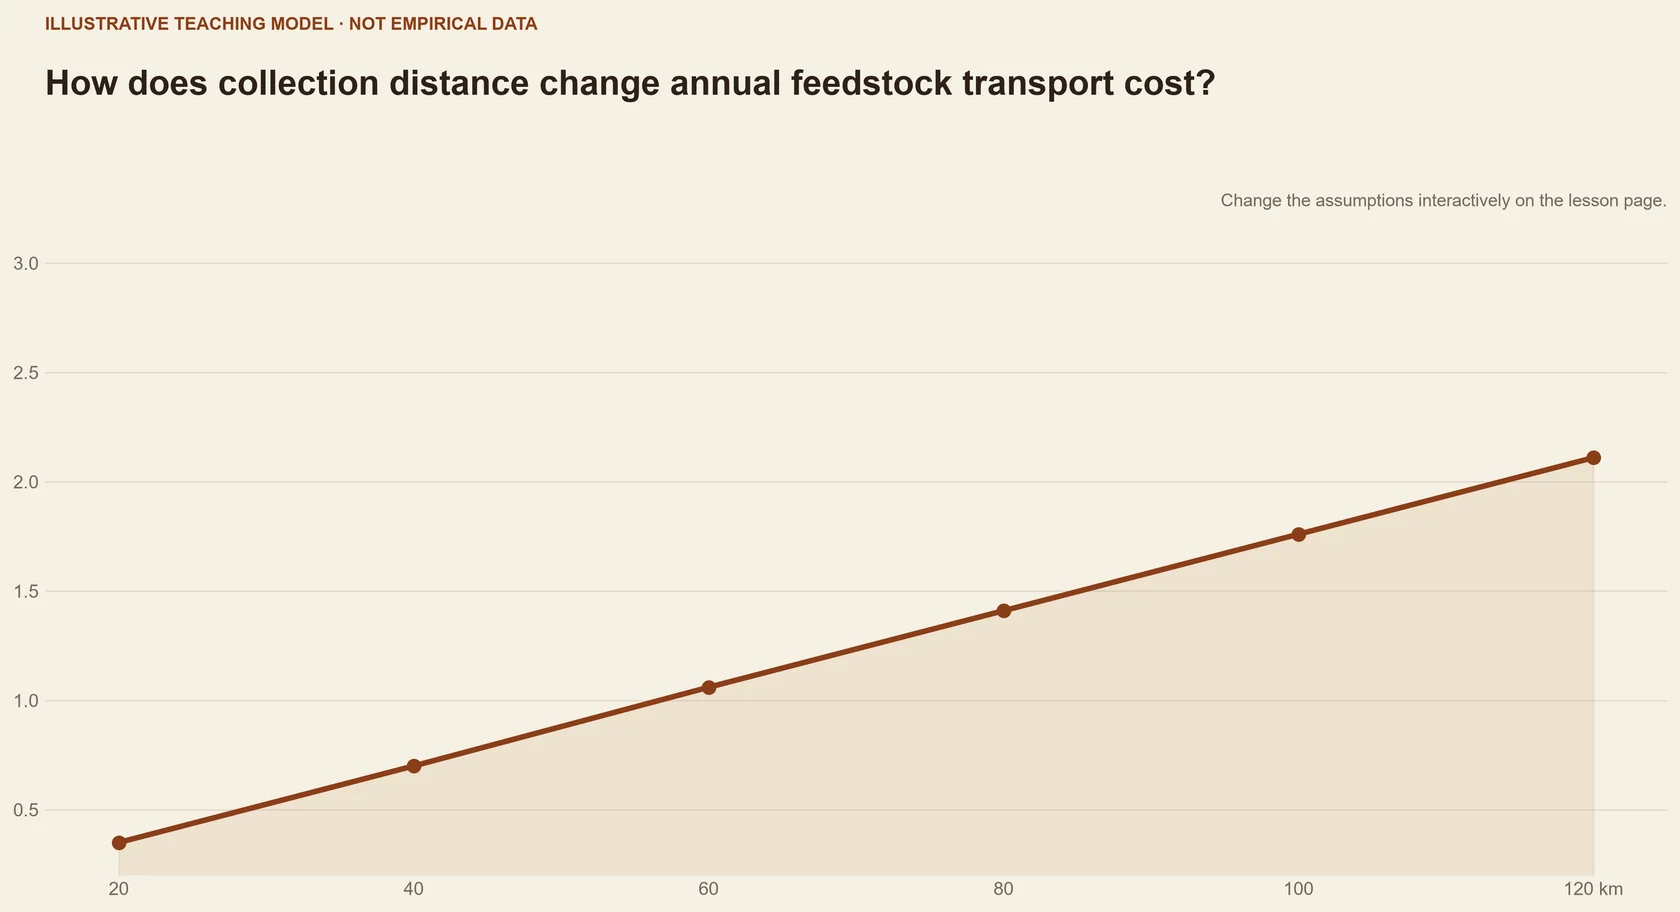
Explore · supply network planner
Explore how collection, preprocessing, storage and transport form one coupled network.
Switch between network designs and inspect the bottleneck exposed by each disruption.
iIllustrative learning model — values are not scientific results or forecasts.
Direct haul
Simple network; long low-density routes raise cost and emissions.
- Nodes
- 6 farms → 1 plant
- Main risk
- Route length
Worked example
Wet tonnes versus delivered dry matter
Two suppliers quote the same wet-tonne price but differ in moisture, distance and storage loss.
- 01
Convert price and payload to delivered usable dry matter.
- 02
Add preprocessing, storage loss and unloading or rejection risk.
- 03
Test one month of supply disruption and an alternative source.
The lowest quoted tonne can be the highest-cost and least reliable usable supply.
Case file
Biomass supply chain network design: An optimization-oriented review and analysis
- Why it is here
- The review structures the decisions and constraints in biomass network design.
- What to inspect
- Inspect which decisions belong to strategic, tactical and operational scales.
- Limitation
- A review organizes models but does not supply local data or validation.
Core references
- Hamid Ghaderi, Mir Saman Pishvaee and Alireza Moini (2017). Biomass supply chain network design: An optimization-oriented review and analysis.https://doi.org/10.1016/j.indcrop.2016.09.027 ↗
- Welfle, Gilbert and Thornley (2014). Increasing biomass resource availability through supply chain analysis.https://doi.org/10.1016/j.biombioe.2014.08.001 ↗
Further reading +1
- Gital Durmaz and Bilgen (2020). Multi-objective optimization of sustainable biomass supply chain network design.https://doi.org/10.1016/j.apenergy.2020.115259 ↗
Knowledge check
Key takeaway
Deployable supply is a quality-controlled service over time, not a pile of annual mass.
Transport cost is adequately represented by average straight-line distance multiplied by wet mass.
Network routes, payload and moisture, seasonal inventories, losses, modes, interfaces and disruption scenarios.