Before you begin
Supply chains, transport and storage →The question
Which site survives all necessary layers—not just the cheapest one?
Learning objectives
- 01Distinguish site screening from site selection and permitting.
- 02Build exclusion, suitability and network criteria transparently.
- 03Include community and cumulative-impact evidence alongside engineering data.
Core explanation
Siting is a multi-layer decision. Resource proximity matters, but so do electricity, heat, water, hydrogen, pipelines, roads, rail, ports, storage, workforce, product markets and residual outlets. Some layers exclude sites; others rank them; others require negotiation. Combining them into one score without explanation can hide decisive constraints.
A screening tool such as BioSiting can reveal resources and infrastructure around candidate locations and support early TEA/LCA framing. It cannot establish land control, permits, interconnection, contracts, local acceptance or construction feasibility. Those require project-specific evidence and engagement.
Environmental justice and cumulative impacts are not optional map decorations. Existing pollution, traffic, water stress, employment quality, benefit distribution and community priorities can change both suitability and project design. Spatial data should support engagement, not substitute for it.
Key concepts
Site screening
Early elimination or ranking using documented spatial criteria.
Exclusion criterion
A condition that makes a site unacceptable rather than merely less preferred.
Infrastructure readiness
Availability, capacity, timing and contractual access to required networks and utilities.
Cumulative impact
Combined burden of the proposed project with existing and foreseeable stressors.
Visual explanation
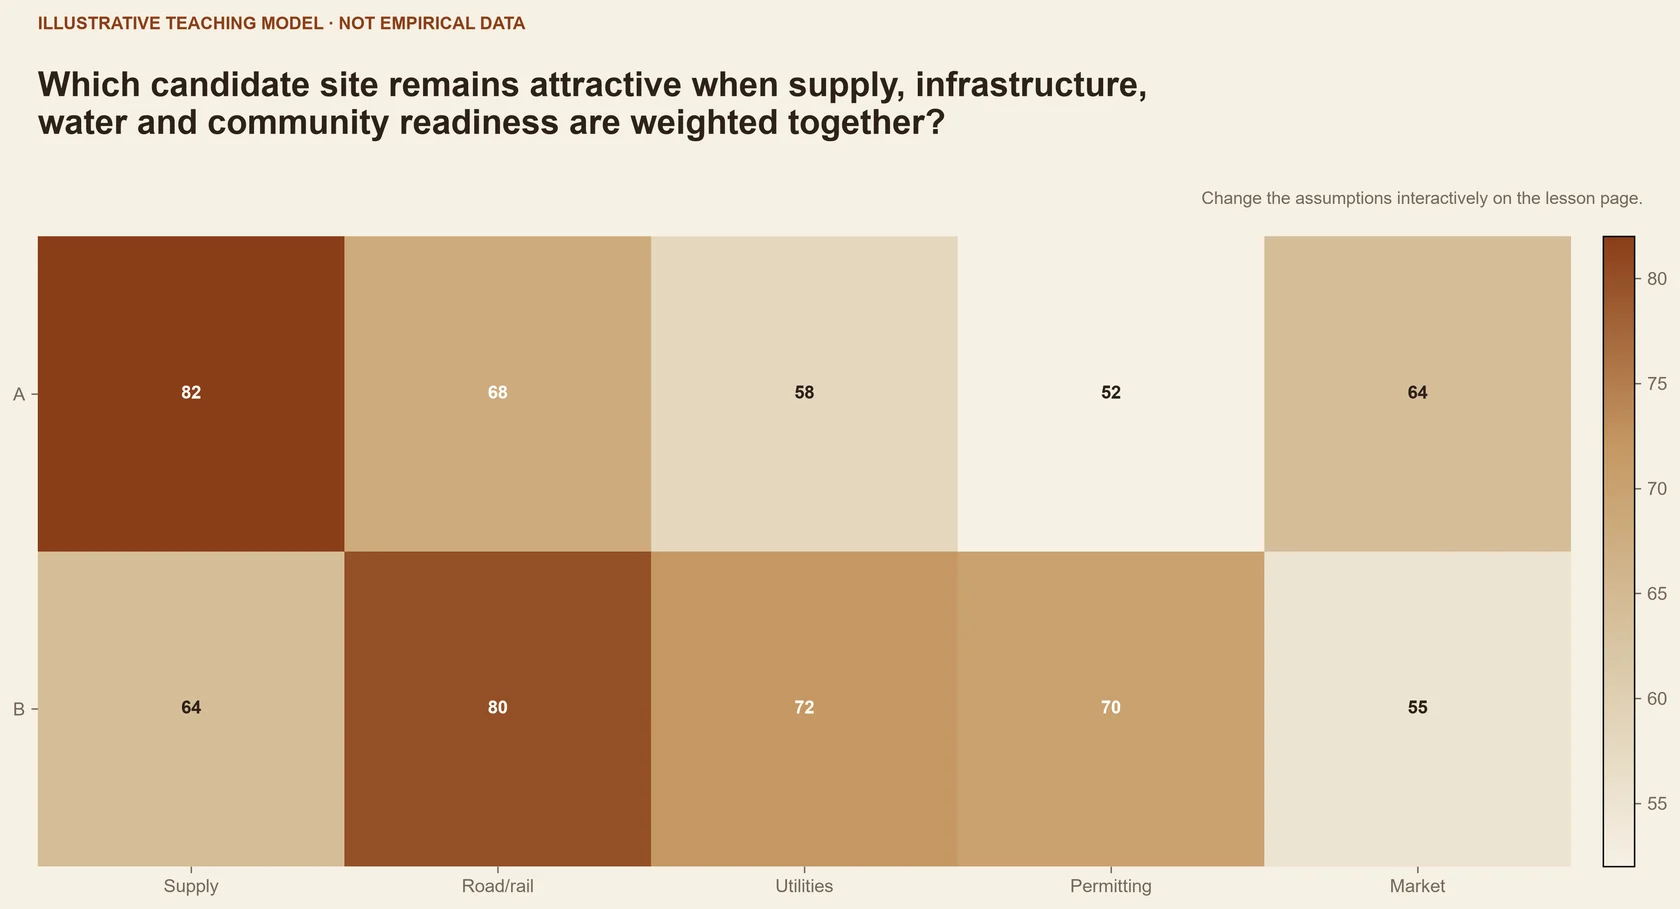
Explore · layered site explorer
Screen candidate sites with exclusion, resource, logistics, utility and community layers.
Toggle layers and compare which candidate remains admissible under the full stack.
iIllustrative learning model — values are not scientific results or forecasts.
Site A: central
Strong logistics but conflicts with an exclusion layer.
- Feasibility
- Hold
- Missing
- Permitting
Worked example
Three candidate biorefinery sites
One is closest to feedstock, one to utilities and one to market and transport infrastructure.
- 01
Apply legal, environmental and physical exclusions before scoring.
- 02
Score network capacity and timing, not presence alone.
- 03
Keep community evidence and unresolved contracts visible as separate decision gates.
The nearest-resource site may fail an exclusion or infrastructure gate; the highest weighted score still needs project evidence.
Case file
GIS-based biomass resource assessment with BRAVO
- Why it is here
- BRAVO is a foundational example of connecting GIS resource data to siting decisions.
- What to inspect
- Inspect how spatial resolution and transport assumptions shape candidate regions.
- Limitation
- Modern siting also needs permitting, equity and current infrastructure data.
Tool in context
BioSiting
- Use it for this task
- Explore how public resource and infrastructure layers support national-scale screening.
- Limitation
- A screening map is not a permit, supply contract or deployability decision.
Inputs, outputs & scope
- What it is
- A geospatial platform for exploring U.S. bioeconomy resources, infrastructure and candidate sites.
- Problem it addresses
- What resources and infrastructure surround a candidate facility location?
- Inputs
- Location, buffer radius, resource layers, infrastructure and pathway choices.
- Outputs
- Mapped inventories, buffer summaries and downloadable spatial data.
- Typical applications
- Facility screening, resource context and early TEA/LCA framing.
Core references
- Noon and Daly (1996). GIS-based biomass resource assessment with BRAVO.https://doi.org/10.1016/0961-9534(95)00065-8 ↗
- Hamid Ghaderi, Mir Saman Pishvaee and Alireza Moini (2017). Biomass supply chain network design: An optimization-oriented review and analysis.https://doi.org/10.1016/j.indcrop.2016.09.027 ↗
Further reading +2
- Lawrence Berkeley National Laboratory / Joint BioEnergy Institute (2024). BioSiting Tool v2.Open source ↗
- QGIS / OSGeo (2026). QGIS Documentation.Open source ↗
Knowledge check
Key takeaway
A map can screen sites; deployment requires land, capacity, permission, contracts and legitimacy.
The location with the shortest average feedstock distance is the optimal and deployable site.
Exclusions, utility capacities, network access, land and permits, cumulative impacts, community priorities and contract status.