The question
Which real-world stress breaks the mathematically optimal plan?
Learning objectives
- 01Identify the gap between mathematical feasibility and implementation feasibility.
- 02Use robustness, alternatives and implementation gates to test a recommendation.
- 03Explain why laboratory excellence does not imply large-scale deployment.
Core explanation
Optimization finds the best represented solution for an objective under represented constraints. It does not know missing contracts, political limits, construction sequences, financing covenants, supplier behavior, community priorities, technology learning or data errors unless they are encoded. A narrow optimum can therefore sit at a fragile corner of the modeled world.
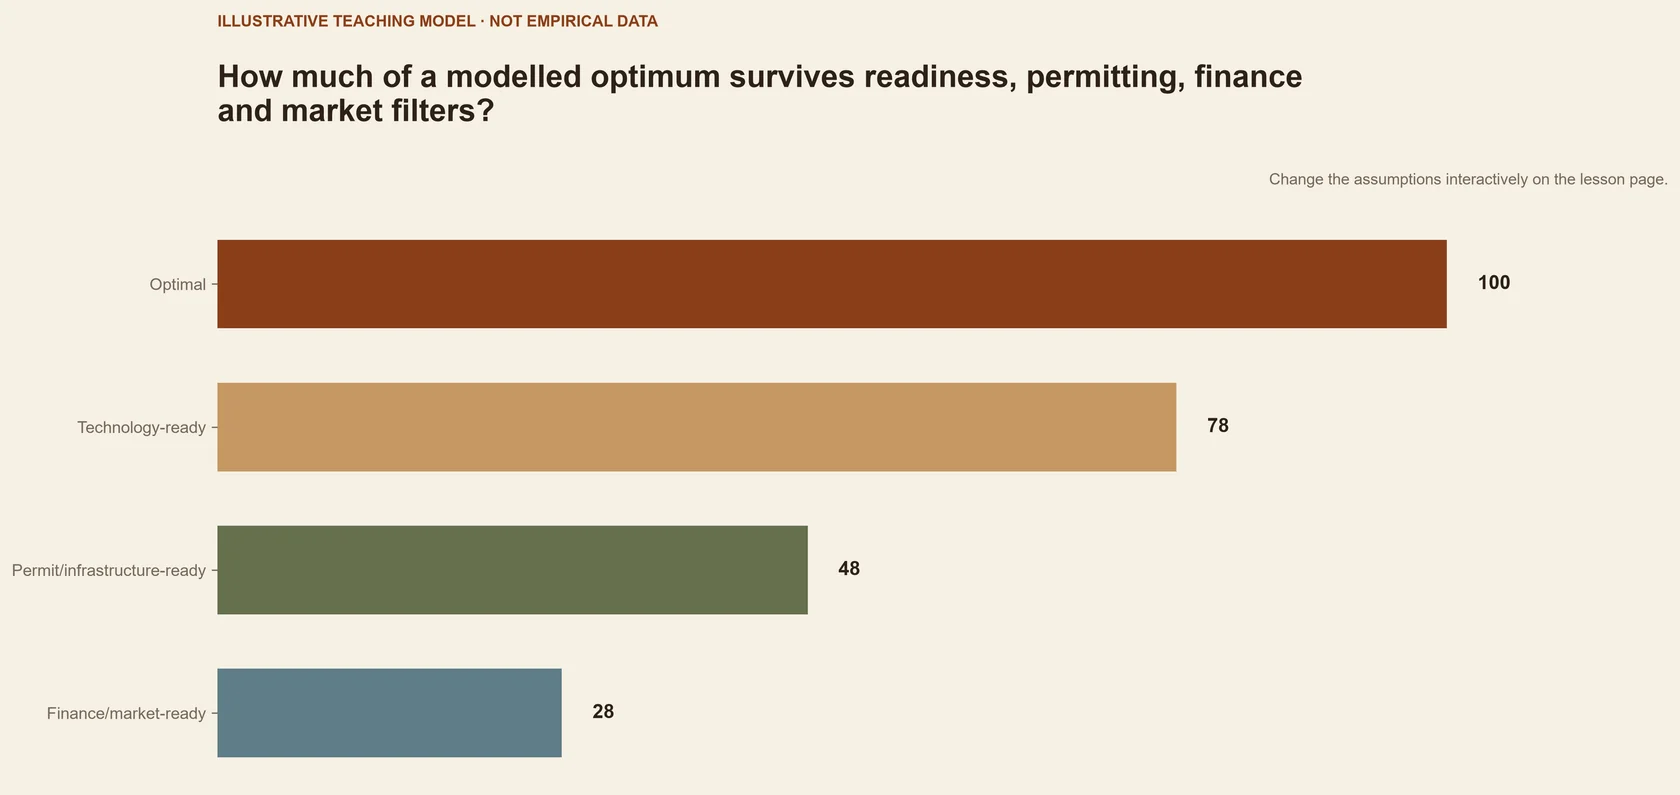
Deployability asks whether actors can and will implement the plan within time, authority, finance, infrastructure and risk. Test adverse scenarios, near-optimal alternatives, phased decisions, real-options value, procurement and permitting gates, and who must coordinate. A slightly higher modeled cost can buy diversification, learning and reversibility.
The same logic applies to laboratory technology. High yield or selectivity is one performance dimension. Scale-up requires continuous operation, feed variability, safety, separation, equipment, product qualification, supply, markets and outcomes. Deployment evidence accumulates across modules; it is not inferred from a single result.
Key concepts
Model optimum
Best solution within the model’s explicit objective, data and constraints.
Robustness
Ability to remain acceptable across plausible changes and errors.
Near-optimal solution
An alternative with a small objective penalty that may improve other properties.
Implementation gate
Evidence or approval required before a plan can progress.
Visual explanation
Explore · deployment stress test
Stress-test an optimum against uncertainty, institutions, finance and implementation capacity.
Advance the plan through five deployment gates; a failed gate reveals what optimization omitted.
Supply variability
Can the plan operate in a poor year, not just the mean year?
Worked example
The cheapest single-facility plan
A model selects one large facility supplied by the lowest-cost region.
- 01
Test harvest failure, road closure, price response and construction delay.
- 02
Generate smaller diversified near-optimal alternatives.
- 03
Add permits, contracts, financing and community milestones as gates.
The deployable recommendation may be a phased portfolio rather than the mathematically cheapest endpoint.
Case file
Ambient-pressure conversion of plastic waste to jet fuel cycloalkanes by tandem hydropyrolysis and vapour-phase hydrogenation
- Why it is here
- The public pathway is a concrete prompt for separating technical promise from deployment evidence.
- What to inspect
- Inspect which claims are experimentally supported and which require supply, siting, market or policy evidence.
- Limitation
- The paper is not presented here as proof of commercial deployment.
Tool in context
TECHTEST
- Use it for this task
- Screen performance and cost assumptions before detailed project modelling.
- Limitation
- A screening tool does not replace a detailed process design, project finance model or critical review.
Inputs, outputs & scope
- What it is
- A spreadsheet-based early-stage tool combining simplified techno-economic and life-cycle analysis.
- Problem it addresses
- Which performance factors dominate the potential cost and energy profile of an emerging technology?
- Inputs
- Technology performance, lifetime, energy and cost assumptions, and a benchmark.
- Outputs
- Screening-level cost, energy and scenario comparisons.
- Typical applications
- Early R&D prioritization, benchmark comparison and scenario screening.
Core references
- Eason and Cremaschi (2014). A multi-objective superstructure optimization approach to biofeedstocks-to-biofuels systems design.https://doi.org/10.1016/j.biombioe.2014.02.010 ↗
- U.S. Department of Energy (2024). Feedstock-Conversion Interface Consortium: Crosscutting Analysis Research.Open source ↗
Further reading +1
- Hamid Ghaderi, Mir Saman Pishvaee and Alireza Moini (2017). Biomass supply chain network design: An optimization-oriented review and analysis.https://doi.org/10.1016/j.indcrop.2016.09.027 ↗
Knowledge check
Key takeaway
Optimal is a property of a model solution; deployable is a property of an evidence-backed implementation pathway.
Once a technology or allocation is technically feasible and cost-optimal, remaining barriers are merely communication problems.
Omitted constraints, adverse scenarios, near-optimal alternatives, actor incentives, implementation sequence and reversible choices.