The question
Which alternatives are non-dominated—and why?
Learning objectives
- 01Distinguish uncertainty, sensitivity and trade-off analysis.
- 02Read Pareto alternatives without collapsing them into one hidden weighting.
- 03Connect outcome distributions to stakeholder and decision context.
Core explanation
A trade-off occurs when improving one outcome worsens another within the feasible set. Synergy occurs when outcomes improve together. Both depend on boundary and baseline. Cost–GHG comparisons may miss land, water, air quality, labor or distribution; adding indicators can reveal new conflicts but also makes priorities explicit.
Sensitivity asks how output changes when an input or assumption changes. Uncertainty characterizes plausible values and confidence in inputs, models and outcomes. Scenario analysis tests coherent alternative futures. They are related but not interchangeable: a highly sensitive parameter may be well known, while an uncertain parameter may have little decision effect.
Multi-objective analysis can show a Pareto frontier: alternatives where no objective improves without worsening another. The frontier informs negotiation but does not choose social values. Report the alternatives, constraints, stakeholder implications and robustness before applying weights or selecting a preferred point.
Key concepts
Trade-off
A conflict in which improving one outcome worsens another.
Sensitivity
Degree to which an output responds to a changed input or assumption.
Uncertainty
Incomplete knowledge about values, models or future states.
Pareto frontier
Set of non-dominated alternatives across multiple objectives.
Visual explanation
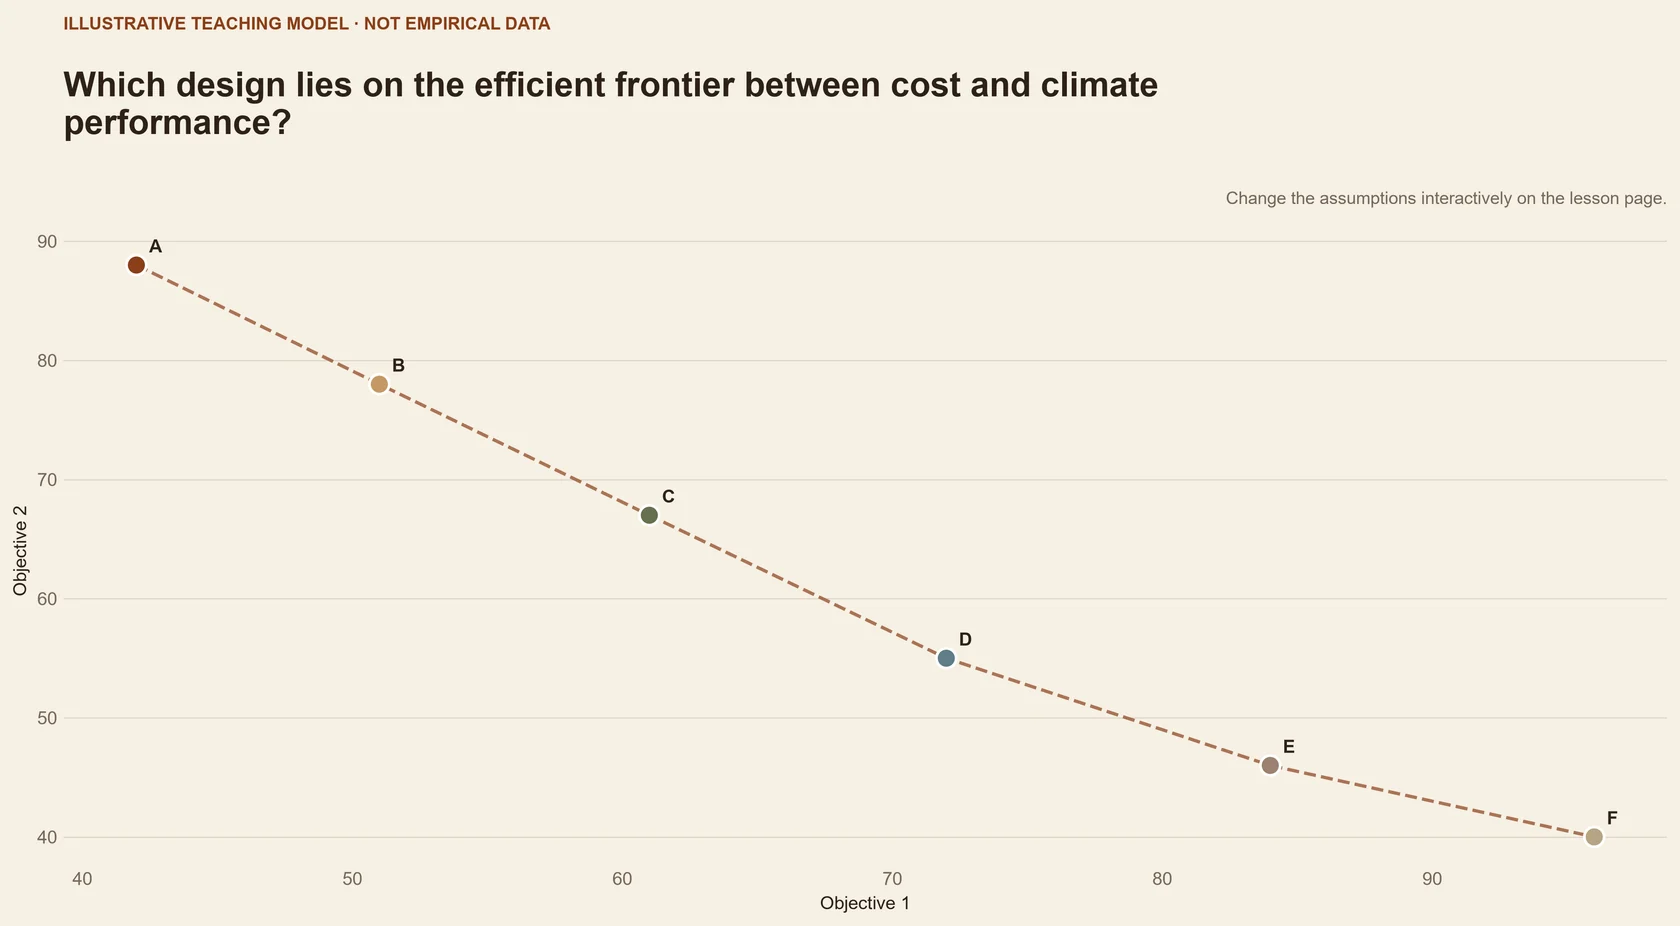
Explore · pareto explorer
Explore trade-offs without collapsing unlike outcomes into an arbitrary score.
Select an outcome pair, then compare frontier and dominated options; no weights are used.
iIllustrative learning model — values are not scientific results or forecasts.
Option A · lower cost
Lowest cost among the shown options, with moderate climate performance.
- Cost
- Low
- GHG
- Medium
Worked example
Cost, GHG and water for three pathways
No pathway is best on all three outcomes, and key inputs vary by scenario.
- 01
Normalize only for visualization; retain physical units in the analysis.
- 02
Identify dominated and Pareto-efficient alternatives.
- 03
Test whether rankings persist across energy, price and water scenarios.
The useful output is a transparent choice set and its conditions, not an unexplained composite score.
Case file
Carbon-negative valorization of biomass waste into affordable green hydrogen and battery anodes
- Why it is here
- This public case is useful for inspecting coupled product, energy and environmental objectives.
- What to inspect
- Inspect which outputs improve together and where a trade-off appears.
- Limitation
- The paper's selected indicators do not exhaust social, market or territorial outcomes.
Core references
- Gital Durmaz and Bilgen (2020). Multi-objective optimization of sustainable biomass supply chain network design.https://doi.org/10.1016/j.apenergy.2020.115259 ↗
- Eason and Cremaschi (2014). A multi-objective superstructure optimization approach to biofeedstocks-to-biofuels systems design.https://doi.org/10.1016/j.biombioe.2014.02.010 ↗
Further reading +2
- International Organization for Standardization (2006). ISO 14040:2006 Environmental management — Life cycle assessment — Principles and framework.Open source ↗
- Kanzian et al. (2013). Design of forest energy supply networks using multi-objective optimization.https://doi.org/10.1016/j.biombioe.2013.10.009 ↗
Knowledge check
Key takeaway
Outcome assessment should reveal trade-offs, uncertainty and who experiences them—not hide them in one score.
A weighted score objectively resolves multi-dimensional outcomes once the arithmetic is correct.
Physical indicators, normalization and weights, uncertainty distributions, scenario coherence, Pareto alternatives and stakeholder impacts.